
RSB Certification Explained: What It Means for Market Access, Compliance, and Credibility

By Urszula Szalkowska, managing director, Europe, EcoEngineers

Across global markets, from the European Union (EU) to international aviation and beyond, companies face growing scrutiny from regulators, investors, and society. In that environment, credible, third-party sustainability certification has shifted from a competitive advantage to a market prerequisite. This article distills the key insights from a recent joint webinar hosted by EcoEngineers and LRQA, focused on Roundtable on Sustainable Biomaterials (RSB) certification: what it is, why it matters, and how the four main certification pathways serve different regulatory and market needs.

What Is RSB: Why Does It Matter?

RSB is widely recognized as one of the most rigorous and comprehensive sustainability certification systems in the world. Unlike narrower compliance schemes, RSB takes a holistic approach that covers:

  • Greenhouse gas (GHG) accounting
  • Environmental, social, and governance (ESG) criteria
  • Full supply chain traceability
  • Strict auditing and verification requirements by accredited certification bodies

RSB is designed not merely to demonstrate compliance, but to deliver credibility and trust, two qualities increasingly demanded by offtakers, regulators, and investors alike. As greenwashing faces heightened regulatory and legal challenge, the integrity of the certification system and the independence of the auditor behind it matters more than ever.
LRQA, with support from EcoEngineers received RSB recognition for certification at the beginning of 2026 ensuring qualification to certify clients under all four RSB pathways described below.

The Four RSB Certification Pathways

1. RSB EU RED: Regulatory Compliance for EU and UK Markets

The RSB EU Renewable Energy Directive (RED) scheme is aligned with the EU’s RED III and is formally recognized by the European Commission. This pathway is mandatory for liquid and gaseous fuels, e-fuels, Sustainable Aviation Fuel (SAF), and low-carbon marine fuels produced or imported into the EU and the United Kingdom (UK).

Certification under RSB EU RED allows economic operators to:

  • Demonstrate compliance with EU sustainability and GHG criteria
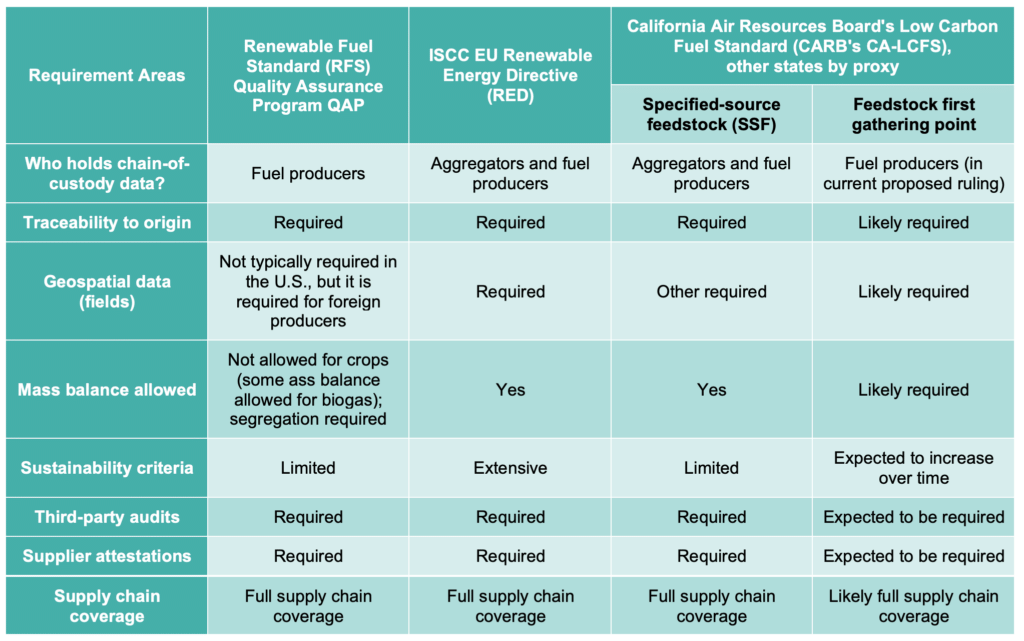
  • Meet mass balancing and supply chain traceability requirements
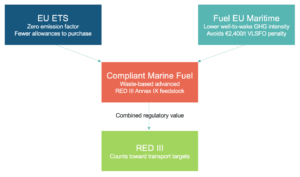
  • Count fuels toward binding targets under frameworks including RED III, ReFuelEU Aviation, and FuelEU Maritime, and reduce emissions under ETS.

This is regulatory certification in the strictest sense: highly structured, rigorously audited, and critical for market access. Without recognized certification, a product simply does not count toward EU or UK compliance targets.

2. RSB CORSIA: International Aviation and SAF Eligibility

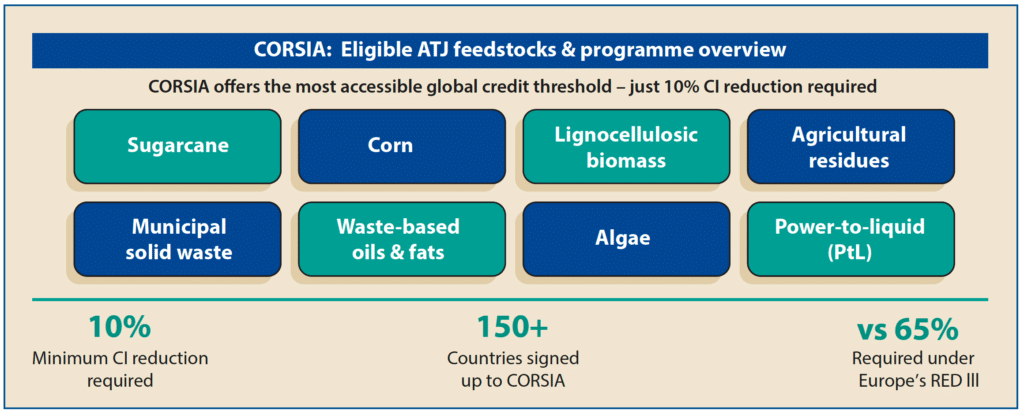
The RSB Carbon Offsetting and Reduction Scheme for International Aviation (CORSIA) is aligned with the International Civil Aviation Organization (ICAO) and its CORSIA. Sustainability certification under this pathway is required for SAF to be eligible under the CORSIA program, which serves as the primary global market-based mechanism for aviation emissions management.

RSB CORSIA certification verifies that SAF meets:

  • Required lifecycle GHG savings thresholds
  • CORSIA-specific sustainability criteria
  • Supply chain traceability requirements
  • As aviation faces intensifying pressure to decarbonize, RSB CORSIA certification is becoming central to SAF market development globally, particularly for producers seeking access to international airline customers and bilateral agreements.

3. RSB Global Fuels: Credibility Beyond Compliance

The RSB Global Fuels standard is a voluntary certification, but voluntary does not mean optional for companies with ambitions beyond their home market. This pathway is particularly valuable in two situations: where regulation is still evolving, and where companies want to demonstrate sustainability leadership ahead of mandatory requirements.

RSB Global Fuels covers a wide range of products, including biofuels, advanced fuels, and emerging pathways. It offers:

  • Credibility in markets where regulatory trust frameworks are not yet in place
  • Stronger relationships with offtakers who demand verified sustainability credentials
  • Potential premium pricing based on certified sustainability performance

For producers operating in dynamic or emerging markets, RSB Global Fuels certification can be the difference between a trusted supply chain partner and an undifferentiated commodity supplier.

4. RSB Global Products: Extending Certification Beyond Fuels

The RSB Global Products standard extends the RSB certification framework beyond fuels into bio-based chemicals, plastics, and other renewable materials, including packaging, pharmaceuticals, and specialty materials. As demand grows for defossilization of industrial supply chains and circular economy solutions, this pathway addresses a critical gap in sustainability verification.

Certification under RSB Global Products allows companies to:

  • Verify sustainable sourcing across complex supply chains
  • Demonstrate reduced environmental impact compared to fossil-derived alternatives
  • Provide credible, audited sustainability claims to customers and regulators

As consumer brands and industrial buyers tighten their supplier sustainability requirements, RSB Global Products certification provides an independent basis for claims that would otherwise be vulnerable to greenwashing accusations.

The Common Thread: Integrity in a World of Heightened Scrutiny

Across all four pathways, one principle is consistent: a certification is only as strong as the system behind it and the people delivering it. Regulators are tightening requirements. Investors are demanding evidence. Offtakers are conducting deeper due diligence. And legal exposure for unfounded sustainability claims is growing.
High-quality auditing and verification are therefore not a compliance checkbox; it is a fundamental enabler of market participation, financing, and long-term trust. EcoEngineers and LRQA bring deep technical expertise in renewable fuels, lifecycle analysis, and sustainability frameworks to every RSB certification engagement, ensuring clients receive verification that withstands regulatory and market scrutiny.

Ready to Pursue RSB Certification?

Whether you are seeking to access EU markets under RED III, qualify SAF for CORSIA, or build credibility in voluntary markets, EcoEngineers and LRQA can guide you through the RSB certification process, from scheme selection and documentation review through audit and ongoing compliance.
Contact uszalkowska@ecoengineers.us to learn which RSB pathway is right for your business and how to get started.

To learn more, visit our website or watch our on-demand webinar, Build Trust with Sustainability: How RSB Strengthens Your Market Position.

About the Expert

Urszula Szalkowska is managing director, Europe, and leads EcoEngineers’ European practice, supporting both European-based clients and international clients doing business in the EU. She advises businesses on compliance with national regulations in European Union Member States (EU MS) and helps navigate the highly regulated renewable energy markets. Ms. Szalkowska coordinates global climate policy and regulations in the U.S. and the EU.

About EcoEngineers

EcoEngineers, an LRQA company, is a consulting, auditing, and advisory firm exclusively focused on the energy transition and decarbonization. From innovation to impact, EcoEngineers helps its clients navigate the disruption caused by carbon emissions and climate change. Its team of engineers, scientists, auditors, consultants, and researchers live and work at the intersection of low-carbon fuel policy, innovative technologies, and the carbon marketplace. For more information, visit www.ecoengineers.us.

Summary: Finalized RFS Set Rule 2 (2026–2027)

This article was originally published by Lisa Hanke on LinkedIn on April 9, 2026.

The U.S. Environmental Protection Agency (USEPA) released the Final Rule for Renewable Fuel Standard (RFS) Set Rule 2 on March 27, 2026. The rule establishes volume requirements for 2026 and 2027 and introduces several programmatic, compliance, and technical updates that are expected to impact renewable fuel producers, obligated parties, and verification activities. Below are the total applicable volumes, measured in billion RINs (renewable identification numbers).

Total Applicable Volumes for 2026 and 2027 (billion RINs)

The USEPA set Renewable Volume Obligations (RVOs) for two years (2026–2027) rather than three, citing increased uncertainty in projecting further out and a desire to avoid later revisions. Because the final rule was issued after the start of 2026, the agency characterizes the 2026 standards as partially retroactive but indicates obligated parties can still meet the standards in the market.

The implied conventional biofuel volume remains 15 billion gallons per year. The USEPA acknowledged supply may fall short but expects the gap can be met with additional volumes of advanced biofuel. The USEPA’s growth assumptions are driven primarily by soybean oil, with smaller increases from used cooking oil and animal fats, and the agency projects renewable CNG/LNG growth may be constrained by vehicle availability rather than fuel supply.

Small Refinery Exemptions (SREs) are annual waivers granted by the USEPA to small petroleum refineries (under 75,000 barrels per day) that demonstrate “disproportionate economic hardship” in complying with regulation’s blending requirements. In the rule, the USEPA finalized a 70% partial reallocation of exempted RVOs from 2023–2025 into the 2026–2027 compliance years. It cites its 2025 SRE decisions (including a large set of decisions issued in August 2025 and additional decisions in November 2025) as creating potential market impacts. The partial reallocation is intended to mitigate negative demand impacts in 2026–2027 while recognizing the role of carryover RINs in maintaining RIN market liquidity.

Cellulosic Waiver Credits (CWCs) are a mechanism that allows obligated parties (refiners/importers) to comply with cellulosic biofuel mandates when the market fails to produce enough physical biofuel. In the rule, the USEPA waived the 2025 cellulosic biofuel requirement, triggering availability of CWCs priced at $1.91 for compliance flexibility.

Ethanol from corn kernel fiber is classified as crop residue and eligible for cellulosic ethanol. In the new rule, the USEPA assumes 90% facility adoption with a 1% conversion rate, declining to adopt higher claimed rates due to insufficient data.

In the RFS, equivalence values are numerical factors assigned by the USEPA to determine how many RIN credits are generated per physical gallon of renewable fuel, based on energy content relative to ethanol. In this rule the USEPA addressed the following (effective 2027):

  • The USEPA opted not to change Renewable diesel and renewable jet fuel equivalence values set at 1.5.
  • Renewable naphtha equivalence value was set at 1.4.
  • The implemented changes to correct prior over-crediting of fossil-derived hydrogen content.

The USEPA also specified where RINs must be generated for most renewable fuels:

  • Domestic producers at the point of production or point of sale
  • Foreign RIN-generating producers at the point of production or when the fuel is loaded for transport to the covered location
  • Importers upon importation into the covered location

For renewable natural gas (RNG) and fuels that are gaseous at standard temperature and pressure (e.g., renewable CNG/LNG), RINs must be generated no later than five business days after all applicable RIN generation requirements are met, with added clarification of EMTS submission timing. The rule includes an illustrative monthly RNG example tying the “fuel production date” to the end of the production month once the final required pipeline statement is received.

Biogas Regulatory Reform Rule

The Biogas Regulatory Reform Rule (BRRR) is a set of regulations finalized by the USEPA in 2023. It streamlines how biogas-to-RNG projects are registered, measured, and reported to generate RINs. Below are some changes that were implemented by the recent Set Rule.

  • Engineering reviews and sampling frequency reduced to once every three years starting in 2027.
  • RNG producers now need to submit a Certificate of Analysis (CoA) once every three years rather than annually. 
  • Registration requirements simplified by removing certain meter justification requirements.
  • Eliminates several quarterly reporting requirements, including certain end-of-quarter renewable fuel/RIN ownership calculations and specific quarterly reporting elements for biogas transportation fuel energy and sales location.
  • Adds a RIN generation reason code beginning January 1, 2027.
  • Engineering review site visits must be conducted within six months prior to submitting a registration request, and the USEPA added additional approved measurement protocols (e.g., AGA/ASME/ISO methods and additional ASTM methods for gas constituents) to support biogas/RNG measurement and testing.
  • Third-party auditors must renew registration every two years.
  • Updates were made to Table 1 pathways without invalidating existing registrations.
  • Adds new biointermediates including activated sludge and converted oils.

In addition to these changes, the USEPA redefined some of its entities within the BRRR. They are as follows:

  • Renewable fuel producer is defined as “any person that owns, leases, operates, controls, or supervises a facility where renewable fuels are produced.”
  • Renewable fuel oil is defined as “heating oil that is renewable fuel and that meets paragraph (2) of the definition of heating oil,”
  • Renewable naphtha is defined as “naphtha that is renewable fuel,”
  • Renewable jet fuel is defined as “jet fuel that is renewable fuel and that meets ASTM D1655 or ASTM D7566.”
  • Foreign renewable fuel producer is defined as “any person that owns, leases, operates, controls, or supervises a facility outside the covered location where renewable fuel is produced.”
  • Importer was previously defined as “any person who imports transportation fuel or renewable fuel into the covered location from an area outside of the covered location, the importer of record or an authorized agent acting on their behalf, as well as the actual owner, the consignee, or the transferee, if the right to withdraw merchandise from a bonded warehouse has been transferred.”

Overall, the Set Rule provides additional compliance flexibility, clarifies longstanding implementation issues, and adjusts crediting methodologies. While generally viewed positively by industry, the changes will require careful review of registration, reporting, and auditing practices beginning in 2026 and 2027.


Our team is ready to assist you with working through your questions and issues to successfully comply with these updates to the RFS. If you haven’t already, the time to start is now, and EcoEngineers can be your guide through this transition period. Please reach out to us with any questions or issues at clientservices@ecoengineers.us

Transforming Compliance Challenges Into Credit Opportunities

New True-Up and Deficit Mechanisms Under California’s Low Carbon Fuel Standard Are Reshaping Credit Risk, Rewarding Conservatism, and Penalizing Operational Drift 

By Brad Pleima, president and Alicia Jones, compliance consulting services director EcoEngineers, an LRQA Company  

California’s Low Carbon Fuel Standard (CA-LCFS) has moved into a more disciplined phase. Following amendments adopted in 2025, the program now features a steeper carbon intensity (CI) reduction trajectory, the transition to California Greenhouse Gases, Regulated Emissions, and Energy Use in Transportation (CA-GREET) 4.0 modelling, and, most significantly, a formalized true-up and deficit obligation structure with a 4x penalty for CI exceedances. 

For market participants, this is not a cosmetic update. It is a structural recalibration of risk. Whereas previously credit exposure was largely tied to production volumes and benchmark trajectories, the revised framework now links financial outcomes directly to verified operational performance. CI management is no longer an annual reporting exercise, it is a balance sheet variable. 

Rebalancing the Credit Market 

The regulatory shift comes after several years in which credit generation consistently outpaced deficit creation. As fuel supply diversified and low-CI pathways expanded, the credit bank accumulated at pace, exerting sustained downward pressure on prices. 

The California Air Resources Board’s (CARB’s) response was deliberate. The amended rule tightens the CI benchmark curve, expands the program to 2045 and introduces an automatic acceleration mechanism designed to respond to the credit oversupply and bank built over the last several years. Recent quarters have already shown deficits beginning to narrow the surplus gap and Q3 2025 was the first quarter since 2022 where deficits outpaced credit generation. 

But the bigger change lies not in the trajectory, but in the management of a facility’s always moving carbon intensity score.  

The 1x Benefit vs. the 4x Penalty 

Beginning with the 2025 Annual Fuel Pathway Report (AFPR), verified operational CI scores are compared to previously certified pathway CI values. 

Two outcomes are now possible: 

  1. If operational CI improves compared to certified pathway CI: 
    Additional credits are issued at 1x. Producers effectively “true up” the delta between reported and verified performance.  This true up would not occur until after the AFPR is verified by a third-party verifier.   
  1. If operational CI worsens compared to certified pathway CI: 
    Over-generated credits are invalidated (1x), and a 4x deficit obligation applies to the variance. 

In practical terms, that means a fivefold exposure relative to the original overgeneration. At current market values, even modest CI drift can translate into six-figure impacts. Importantly, the penalty is not a cash fine paid to CARB. Credits must be retired from circulation, and the pathway holder bears the market cost of acquiring and surrendering those credits if insufficient balances are held. 

The direction from CARB is clear:  do not operate at a CI score worse than the existing certified pathway CI.  The program now expects active CI understanding and management and incentivizes producers to take a conservative approach with credit generation.   

CA-GREET 4.0: Subtle Model Changes, Real Implications 

The shift from CA-GREET 3.0 to 4.0 introduces updated electricity emission factors, minor changes to fossil fuel intensities, expanded applicability of Tier 1 pathways, and technical revisions for dairy, swine, and landfill gas projects. 

Model-driven CI adjustments tied solely to the transition are exempt from claw-back provisions. However, operational variability remains fully exposed. For renewable natural gas (RNG) facilities, ethanol plants, and renewable diesel producers alike, the primary risk vector is day-to-day plant performance and using ongoing operational data to determine actual CI. 

Operational Drift as Financial Risk 

CI variance can arise from routine operational realities: 

  • Increased grid electricity use during downtime or restarts 
  • Changes in feedstock transport distances 
  • Manure collection variability 
  • Landfill oxygen intrusion 
  • Extreme weather impacts on instrumentation 
  • Maintenance-related flaring events 

Under the revised framework, such deviations are no longer absorbed quietly into future modelling. They are monetized. A facility operating slightly above its certified CI for multiple quarters may face a compounded deficit obligation, particularly if credit prices rise between generation and compliance settlement. 

The structure incentivizes active monitoring rather than retrospective reconciliation. 

The Margin of Safety: Strategic Buffering 

CARB provides one risk management lever: the Margin of Safety (MOS). 

Prior to AFPR verification, pathway holders may elect to apply a CI buffer above their verified operational value. If subsequent CI exceedance falls within that buffer, the 4x deficit penalty is avoided. The trade-off is delayed credit realization. Overly conservative MOS selection reduces near-term revenue but mitigates downside exposure. 

In volatile operational environments, particularly for facilities with high start-stop frequency or variable feedstock characteristics, MOS may function as an insurance mechanism against unforeseen exceedance. But being too conservative will have credit and cash flow impacts as the true up period will not occur until the following year after annual AFPR verification.  For example, an under-generation of credits from a conservative MOS in Q2 2026 would not see true up credits until Q3 or Q4 2027. 

Credit Inventory as Risk Hedge 

Another emerging strategy involves retaining a portion of generated credits in the LCFS Reporting Tool (LRT) account rather than fully monetizing forward.

Because deficit obligations must be satisfied by the following April compliance deadline, when regulated entities submit their annual CA-LCFS compliance reports and must hold sufficient credits in the system to cover any deficits, holding credits provides optionality. If prices appreciate and an exceedance occurs, repurchase costs can materially amplify losses. Credit banking, once viewed primarily as speculative positioning, is increasingly framed as compliance insurance.

This should not be considered a risk mitigation strategy to avoid the deficit obligation 4x penalty but rather a price risk mitigation strategy should a facility fall into the deficit obligation requirement.

From Compliance to Performance Management 

The revised CA-LCFS framework effectively converts CI into a continuously managed operational key performance indicator (KPI). 

Best practice now includes: 

  • Quarterly or monthly CI tracking 
  • Forward modelling of operational scenarios 
  • Early-year corrective action if CI drift appears 
  • Strategic MOS calibration 
  • Credit inventory management aligned to exposure 

For producers, this likely will require enhanced internal carbon accounting systems and closer coordination between operations, commercial, and compliance teams. 

A More Disciplined Market 

The introduction of true-ups and deficit obligations strengthens program integrity. Overgeneration risk is curtailed, credits are retired in cases of exceedance, and performance accountability is sharpened. In doing so, CARB is signaling that the next phase of the CA-LCFS will reward operational precision. 

For participants, the implication is straightforward: carbon intensity is no longer a static modelling output. It is a managed financial parameter. Those who treat it accordingly will navigate the tightened regime with limited disruption. Those who do not may find the 4x penalty mechanism an expensive lesson in operational governance. 


About the Authors 

Brad Pleima profile pic

Brad Pleima is president of EcoEngineers. With over 20 years of experience in the renewable energy and engineering sectors, he has provided advisory services to more than 300 renewable energy production facilities and supported the construction of over $4 billion in anaerobic digester and renewable natural gas projects nationwide.  


Alicia JonesAlicia Jones is the compliance consulting director at EcoEngineers. She works with companies navigating low-carbon fuel programs and evolving carbon market regulations, supporting lifecycle analysis, pathway management, and regulatory compliance strategies across renewable fuels and decarbonization initiatives.  


About EcoEngineers 

EcoEngineers, an LRQA company, is a consulting, auditing, and advisory firm exclusively focused on the energy transition and decarbonization. From innovation to impact, EcoEngineers helps its clients navigate the disruption caused by carbon emissions and climate change. Its team of engineers, scientists, auditors, consultants, and researchers live and work at the intersection of low-carbon fuel policy, innovative technologies, and the carbon marketplace. For more information, visit www.ecoengineers.us. 

Is Hydrogen a Super Pollutant?

This was originally published on LinkedIn by Roxby Hartley, Ph.D. on March 27, 2026.

Well, based on the latest research, there’s a strong case for treating it as one.  A “super pollutant” is typically understood as a gas that produces disproportionate warming relative to its mass and lifetime, often due to strong radiative forcing or system-level chemical interactions. The commonly cited examples are methane, nitrous oxide, and fluorinated gases. These are not dominant by volume, but they account for 50% of near-term climate forcing. Hydrogen does fit this definition through a different pathway, but understanding exactly how it does so allows risks to be managed.

Two recent papers agree. It has a high Global Warming Potential (GWP):

Neither paper sets out to label hydrogen as a super pollutant. Instead, they explicitly model hydrogen’s behavior and interactions within the atmospheric system. Hydrogen is not a primary greenhouse gas in the way CO2 or methane are. Its direct radiative forcing is weak; its combustion products are water and NOx, with NOx levels dependent on temperature. However, the problem is how hydrogen affects atmospheric chemistry: it modifies the hydroxyl radical budget. Hydroxyl radicals are an important pathway for the oxidation and breakdown of many atmospheric gases, especially methane. They are the dominant mechanism for methane oxidation, turning methane into CO2 and H2O, and therefore regulate one of the most important short-lived climate forcers in the system.

Hydrogen also reacts with hydroxyl radicals, so as hydrogen concentrations increase, hydroxyl availability declines. The result is that methane removal slows, and its lifetime increases, leading to rising atmospheric methane concentrations. Hydrogen does not need strong radiative forcing to matter. It amplifies warming by extending methane’s lifetime.

The global hydrogen budget paper quantifies sources and sinks and shows that hydrogen is tightly coupled to atmospheric oxidation capacity. What was historically treated as a trace gas becomes material once scaled through anthropogenic systems. The GWP paper extends this by quantifying hydrogen’s effective warming impact through multi-model simulations. It shows that hydrogen’s climate effect is dominated by indirect pathways, primarily methane lifetime extension, with additional contributions from ozone and stratospheric water vapor. This is the basis for framing hydrogen as a super pollutant. Not because of its direct emissions, but because of how it alters the system governing other pollutants.

It is not as ‘bad’ as you might think: Most comparisons rely on global warming potential per kilogram. On that basis, hydrogen has a high GWP, albeit only 39% of methane’s. However, I am used to working with fuels, and fuel emissions are not typically measured on a per-kilogram basis; instead, fuels are measured in terms of emissions per unit energy. Hydrogen contains roughly 120 MJ per kilogram. Methane is closer to 50 MJ per kilogram. For the same unit of delivered energy, significantly less hydrogen mass is required. When climate impact is normalized per unit energy, hydrogen’s relative performance improves substantially. It is still significant, but certainly not as bad as a GWP100 > 11 kg CO₂e per kg H₂ initially seems to be. To put the scale in context, Ouyang et al. estimate that all rising atmospheric hydrogen between 2010 and 2020 contributed just 0.02°C of global surface warming. The practical implication is that a hydrogen economy can deliver the same energy services as a methane-based system while having a significantly lower warming impact, assuming the same leakage rate per unit of energy.

A 2026 LCA study (Serghini et al., International Journal of Hydrogen Energy) makes this concrete across six European ground transport pathways for green hydrogen. When hydrogen’s GWP100 of 12 kg CO₂e per kg H₂ (from Warwick et al., 2022) is applied to supply-chain leakage, the climate impact of each delivery pathway increases. In some cases, enough to push previously compliant pathways above the EU’s renewable hydrogen threshold of 3.38 kg CO₂e per kg H₂. Liquid hydrogen transport is most affected, with supply-chain losses nearly five times higher than compressed gas by truck. Liquid hydrogen storage requires active refrigeration or a ~1% by mass daily bleed-off to keep the gas in liquid form at < -253 °C. The study also finds that delivery-related stages, that is, conditioning, transport, and deconditioning, account for more than half of the total global warming impact across all scenarios, independent of leakage. The production of green hydrogen is not the problem; getting it where it needs to go is.

Hydrogen’s climate impact is mediated by atmospheric chemistry, making it sensitive to leakage (quoted as 1-10%).  Understanding that allows operators and system designers to:

  • Set leakage thresholds based on climate performance
  • Prioritize infrastructure that minimizes loss
  • Design MRV systems that capture hydrogen emissions directly
  • Understand the transportation mode trade-off against local production

This is the same transition that occurred with methane, but now it is happening earlier in the deployment cycle. Framing hydrogen as a super pollutant is not about limiting its use. It is about correctly identifying where its impact comes from so that it can be managed. Hydrogen remains a viable and, in many cases, advantageous decarbonization pathway. Once the chemistry is understood, the pathway to maintaining hydrogen’s advantage becomes clear: control leakage, measure it accurately, and evaluate performance based on the energy delivered across the full atmospheric system.

Project Spotlight: Hago Energetics

Project Spotlight: Advancing Carbon-Negative Hydrogen with Hago Energetics


Hago Energetics is pioneering a new approach to clean hydrogen production by converting organic waste — such as agricultural residues, landfill gas, and wastewater treatment byproducts — into fuel cell-grade hydrogen and biochar. California is accelerating toward its 2045 carbon neutrality goals, and Hago’s technology addresses two critical challenges at once. It reduces methane emissions from waste streams and decarbonizes hard-to-abate sectors like heavy-duty transportation and industry.

To support commercialization and secure funding for a proposed hydrogen production facility in Madera, California, Hago Energetics sought independent, third-party validation of its carbon footprint. Through the U.S. Department of Energy’s EnergyWerx voucher program, the company partnered with EcoEngineers to conduct a comprehensive life-cycle analysis (LCA) using the CA‑GREET 4.0 model and the Tier 1 CI Calculator for hydrogen. The analysis evaluated multiple production and delivery scenarios, including the role of biochar soil sequestration in reducing overall carbon intensity.

The results confirmed that Hago’s hydrogen pathway can achieve strongly negative carbon intensity scores, reaching as low as ‑492 g CO₂e/MJ when biochar sequestration is included. Even without accounting for biochar, the process remained carbon negative. This third-party validation helped Hago Energetics strengthen investor discussions and secure a U.S. Department of Energy waste‑to‑fuel grant, laying a credible foundation for future scale‑up and commercialization of its carbon‑negative hydrogen technology.

Read the full case study here.


45V and 45Z Tax Credits: How Clean Fuel Producers Can Maximize Value and Minimize Risk

The U.S. energy transition is accelerating, and Sections 45V and 45Z tax credits are playing a central role. These federal incentives are intended to support the production of qualifying low‑carbon fuels. Participation in these programs requires taxpayers to maintain detailed carbon intensity (CI) calculations, document fuel production volumes, and demonstrate compliance with applicable regulatory requirements.

What Are 45V and 45Z Tax Credits?

  • Section 45V – Clean Hydrogen Production Tax Credit: Rewards producers of low-carbon hydrogen based on verified carbon intensity.
  • Section 45Z – Clean Fuel Production Tax Credit: Supports qualifying low-carbon fuel production, including renewable and alternative fuels.

Both credits require detailed CI modeling, production volume tracking, and third-party verification. As regulatory expectations evolve, inaccurate data or weak documentation can create compliance risk—and threaten credit value.

Why Carbon Intensity Accuracy Matters

Carbon intensity sits at the heart of both 45V and 45Z. Producers must demonstrate that their CI calculations are:

  • Technically sound
  • Aligned with GREET modeling and regulatory guidance
  • Supported by transparent data and system boundaries
  • Verifiable under recognized standards

Without a defensible approach, producers risk IRS challenges, downstream compliance issues, or reduced credit value.

How EcoEngineers Supports 45V and 45Z Success

EcoEngineers, an LRQA company, supports organizations pursuing 45V and 45Z tax credits through services that address technical, regulatory, and assurance considerations. It must be noted that EcoEngineers can serve as your consultancy advisor or your third-party verifier, but not both.

  • Education and Strategy: EcoEngineers helps teams understand tax credit mechanics, CI modeling and pathways, the provisional emissions rate (PER) process, and verification requirements through guided workshops and demos. Our education services can be implemented whether you are a consulting or auditing client. 
  • CI Modeling and PER Support: Services include support for Greenhouse gases, Regulated Emissions, and Energy use in Technologies (GREET) model development, carbon data management, scenario analysis, and PER calculations for pathways that do not align with default values.
  • Due Diligence and Readiness Assessments: EcoEngineers conducts due diligence reviews of CI methodologies, data inputs, system boundaries, and data management processes. These reviews may include pre‑verification assessments, gap analyses, and documentation review to evaluate alignment with applicable regulatory frameworks and guidance.
  • Auditing and Verification: EcoEngineers provides pre‑verification, gap analyses, and reasonable assurance verification of facility data, controls, and documentation. We conduct verification activities established frameworks, including ISO 14064‑3, and are designed to support required attestations under Sections 45V and 45Z.
  • Compliance Support: EcoEngineers supports alignment of data, documentation, and reporting processes with established frameworks and emerging tax credit requirements, including implementation of measurement, reporting, and verification (MRV) practices.

The Value of an Independent, Accredited Partner

EcoEngineers is accredited by the ANSI National Accreditation Board (ANAB) as a GHG Validation and Verification Body under ISO/IEC 17029, ISO 14065, and ISO 14064‑3, with additional accreditations across multiple regulatory programs. Partnering with EcoEngineers helps producers:

  • Strengthen CI accuracy and consistency
  • Build credibility with regulators and tax equity investors
  • Reduce IRS, financial, and reputational risk
  • Streamline compliance and transaction readiness

Backed by LRQA’s global assurance platform and deep experience across low-carbon fuel programs, EcoEngineers brings technical rigor and regulatory fluency to high-stakes tax credit strategies.

Get Started with Confidence

Whether you’re evaluating eligibility, preparing for verification, or scaling clean fuel production, EcoEngineers can help you maximize the value of 45V and 45Z tax credits while minimizing compliance risk. Contact clientservices@ecoengineers.us to start the conversation.

The LCFS Has Turned a Pivotal Corner: Q3 2025 Marks the First Deficit in Years

Since 2021, the California LCFS credit market experienced a persistent surplus, with credit creation consistently surpassing compliance needs. This led to an ever-growing credit bank, plummeting prices that stayed at rock-bottom levels. Nevertheless, this trend is now shifting.

Figure 1 California Credit Bank: CARB’s published data showed the first quarterly deficit in many years. Because LCFS reporting lags by approximately seven months, Q3 represents the first observable impact of the 2025 step change –CARB


The credit bank remains substantial; what has shifted is its trajectory. This change is driven by the 9% market adjustment incorporated into the 2025 regulatory update. While one quarter alone doesn’t wipe out a large credit bank, in markets, direction is as important as size. A system that is building inventory operates very differently from one that is reducing it.

For years, the LCFS functioned as a surplus market with ample optionality. Obligated parties had the ability to postpone purchases with minimal risk. Generators operated in an oversupplied environment, competing amid a market anchored by price floors and expectations of increasing inventory.

The 2025 stringency step change has shifted the trajectory. The system has moved from a structural surplus to a structural deficit, causing prices to now reflect factors like investment ROI, bank drawdown rates, supply elasticity, and expectations of future regulatory updates. LCFS credits, which had traded near their floor for a long time due to inventory build-up reducing urgency, are now influenced by a decreasing bank, changing market psychology. Markets are beginning to price in future scarcity before the system becomes critically tight. The earlier uncertainties about the timing and location of regulatory changes have disappeared. We can now observe the initial effects.


EcoEngineers’ LCFS Credit Outlook Provides the Answers

EcoEngineers recognized the early signs of a price collapse driven by surplus, based on expanding renewable diesel capacity and bank growth patterns. Currently, the same balance-sheet analysis suggests ongoing depletion.

We have created a forward-looking model that assesses future bank depletion across various supply scenarios, adjusts for scarcity pricing behaviors, and establishes risk-adjusted price ranges linked to inventory reduction.

Our updated LCFS Credit Outlook provides:

  • Scenario-based bank projections
  • Risk-weighted price ranges
  • Strategic considerations for obligated parties, credit generators, and investors in this evolving market phase

After years of increasing surpluses and floor-level prices, the LCFS market is beginning to reflect a different reality; instead of pricing in abundance, it is beginning to price in scarcity.

The question is no longer whether the LCFS is oversupplied. The data show the direction has shifted.

For market participants, the critical variable is not today’s bank size — it is the speed of change. In a tightening system, timing, procurement strategy, and capital allocation decisions become materially more consequential.

The surplus era created complacency. The next phase will reward foresight.

To purchase EcoEngineers’ LCFS Credit Outlook, contact us at clientservices@ecoengineers.us.

You can also join EcoEngineers at the upcoming EcoForum series, where our experts will unpack the data, explore forward scenarios, and discuss what this new CA-LCFS phase means for compliance strategy, project development, and investment decisions. Link here for more information: https://www.ecoengineers.us/ecoforums/

2026 Low-Carbon and Renewable Fuel Market Outlook: Moving From Policy Momentum to Market Execution

As low-carbon and renewable fuel markets enter 2026, the global energy transition is moving into a new phase. The last several years were marked by ambitious targets, landmark regulations, and significant capital deployment. The coming year will be shaped by the implementation of existing policies and market execution. Across carbon markets, low-carbon fuels, and emerging energy systems, one message is consistent: credibility, flexibility, and operational readiness are becoming decisive factors for success.

Our experts share their views of what’s to come, highlighted in the article below, and linked here to view the 2026 Market Trends & Insights webinar.

European Carbon Markets: Implementation and Certification Readiness

European carbon markets are moving into a decisive implementation phase as policy focus shifts from setting new targets to delivering systems that balance decarbonization with competitiveness. The European Union (EU) Emissions Trading System (ETS) remains central, and will be reformed in 2026, addressing key topics including aviation and maritime sectors, carbon-leakage-exposed industries, and the potential role of permanent carbon removals.

At the same time, the Carbon Border Adjustment Mechanism (CBAM) is transitioning toward full compliance, increasing demand for verified emissions data and defensible carbon accounting across supply chains. The EU is also advancing programs such as the Carbon Removal Certification Framework (CRCF) that emphasize measurable, verifiable, and credible outcomes before market recognition.

Critically, 2026 will bring heightened scrutiny of sustainability certification systems operating under the Renewable Energy Directive (RED). Increased oversight of certification bodies, accreditation requirements, and lifecycle analysis methodologies reflects a broader push for consistency and transparency. In this environment, recognized certification schemes such as the Roundtable on Sustainable Biomaterials (RSB) play a central role in enabling compliant access to European fuel and carbon markets through robust, third-party verification.

Together, these developments signal a clear direction: success in European carbon markets will increasingly depend on execution, data quality, and credible certification—not new regulatory ambition.

Voluntary Carbon Markets: From Speed to Scrutiny

Voluntary carbon markets (VCMs) continue to grow, but under increasingly rigorous conditions. The market is shifting away from rapid, spot-based credit purchases toward longer, more structured procurement processes that emphasize quality, durability, and verification. Offtake agreements are becoming more common, replacing spot transactionspurchases with multi-year commitments that entail more rigorous due diligence across registries, verification bodies, credit rating agencies, investors, and buyers.

At the same time, demand is expanding beyond traditional corporate purchasers, with state and subnational compliance programs accounting for a growing share of voluntary credit use. While this evolution is increasing complexity for project developers, particularly around Article 6 eligibility, credit ratings, and co-benefit requirements, it is also contributing to a more resilient and liquid market where credibility and verified outcomes are essential to securing long-term financing and buyer confidence.

Renewable Natural Gas: A More Disciplined Growth Phase

Renewable natural gas (RNG) markets are entering a phase of operational adolescence. While demand from compliance markets such as the Renewable Fuel Standard (RFS) and state-level low-carbon fuel programs such as the California Low Carbon Fuel Standard remains supportive, project developers are navigating longer timelines and more disciplined capital markets.

We’re seeing pathways into Canadian Fuel Regulation (CFR) progressing, with numerous RNG projects seeking to enter that market. The California Air Resources Board (CARB) is aiming to reduce project approval timelines.

As facilities come online, the focus is shifting from development to performance: optimizing operations, benchmarking against peer facilities, and managing long-term compliance obligations. At the same time, access to experienced operational and compliance talent is emerging as a constraint, particularly as the sector scales.

For RNG producers, success in 2026 will increasingly depend on realistic project planning, operational excellence, and the ability to demonstrate consistent performance over time.

Ethanol and Biodiesel: Building Flexibility into Strategy

Ethanol and biodiesel producers are facing a period of structural uncertainty driven by evolving policy frameworks, including federal and state incentive programs and emerging voluntary markets. While new guidance continues to emerge, many rules remain subject to interpretation and revision.

In response, producers should be rethinking how they position assets for the future. Ethanol is evolving beyond its traditional role as a gasoline blendstock to serve as a platform molecule for sustainable aviation fuel, chemicals, and other low-carbon applications.

Rather than betting on a single pathway, many facilities are pursuing layered decarbonization strategies that combine near-term operational improvements with longer-term investments, such as carbon capture, RNG integration, and process redesigns. This approach creates optionality, allowing producers to adapt as markets and regulations evolve.

Renewable Diesel and SAF: Demand Is Clear, Constraints Remain

Renewable diesel and sustainable aviation fuel (SAF) remain among the most critical decarbonization tools for transportation and aviation. Demand is growing rapidly, driven by regulatory mandates and corporate climate commitments, and is expected to continue rising throughout the decade.

However, supply constraints persist. Feedstock availability, competing uses, trade restrictions, and fragmented regulatory frameworks continue to slow scale-up. While new production pathways such as alcohol-to-jet and power-to-liquids offer long-term promise, they require significant time, capital, and regulatory alignment to reach commercial scale.

In the near term, regulatory complexity, particularly around feedstock eligibility, life-cycle analysis (LCA), and verification, remains one of the most significant challenges for market participants operating across jurisdictions.

Hydrogen: Momentum Tempered by Practical Constraints

Clean hydrogen continues to attract global investment, particularly in regions focused on energy security and long-term decarbonization. While Europe and Asia are advancing rapidly, hydrogen project development in the U.S. and Canada face unique challenges, including high electricity prices, grid constraints, and compressed timelines for federal incentives.

In the near term, developers are increasingly focused on early-stage technical due diligence, lifecycle emissions modeling, and evaluation of multiple incentive pathways. These steps are essential to maintaining project viability in a shifting policy environment.

In the long term, EU investment in hydrogen infrastructure, such as fueling stations and pipelines, points to opportunities for steady growth. In the U.S., growing data centers, vehicle electrification, and industrial energy demand provide a growth trajectory for low-carbon intensity hydrogen from a variety of production pathways.

What 2026 Signals for Market Participants

Across all markets, a common theme is emerging: the transition is no longer about ambition alone. It is about delivering measurable, verifiable results under increasingly rigorous standards.

Organizations that invest early in LCA, compliance planning, and data transparency are better positioned to manage uncertainty and respond to changing market signals. Flexibility and optionality are becoming core components of project strategy, not as a hedge, but as a requirement for long-term resilience.

As 2026 approaches, carbon and fuel markets will continue to grow, but success will favor those who can navigate complexity, demonstrate credibility, and execute with discipline.

Understanding the regulatory frameworks that shape U.S. and state-level carbon markets is essential for anyone working in sustainability, compliance, or renewable fuel development. If you’re looking to build these critical skills and regulatory literacy, check out our EcoForums training series.

To connect with our team of experts across these areas, contact us at clientservices@ecoengineers.us.

The Coming Power Crunch: AI, Data Centers, and the Strain on the Grid

By Roxby Hartley, Ph.D., Climate Risk Director, EcoEngineers

Electricity markets on both sides of the Atlantic are entering uncharted territory. Prices in recent capacity auctions have surged more than 1,000% in some regions, signaling that the era of cheap, abundant electricity is ending. The culprits: explosive growth in data center demand (driven by artificial intelligence), accelerating electrification of heating and transport, and a backlog of clean energy projects waiting years to connect to the grid.[1]

One of the largest regional transmission organizations (RTO) in the U.S., PJM Interconnection, which serves 65 million people from Chicago to Washington, D.C., cleared its 2026/27 auction at the maximum allowable price: $329.17 per megawatt-day, a tenfold increase over 2022 levels.[2] Midcontinent Independent System Operator (MISO) and Britain’s capacity markets reported similar price spikes, showing that this is no isolated phenomenon.


Digital Growth Is Driving Demand Like Never Before

Worldwide, data center electricity consumption is slated to reach around 448 terawatt-hours in 2025 (final figures are not yet available) and is on track to more than double by 2030.[3] The U.S. is expected to account for most of that increase, adding the equivalent of New York State’s power use to the grid in just six years.

Hyperscale facilities consume as much electricity as mid-sized cities. Amazon’s new campus with Talen Energy alone will require 960 megawatts of continuous power.[4] Unlike other large industrial users, data centers cannot easily reduce load during peak times, meaning they place constant, inflexible stress on the grid.


Fossil Fuels Still Dominate the Response

Despite ambitious clean energy targets, natural gas and coal continue to dominate capacity auctions. In PJM’s latest results, gas made up 45% of cleared capacity and coal 22%, with renewables just 4%.[5] Interconnection queues are the bottleneck: PJM has over 46 GW of approved renewable projects waiting three to five years for grid connection.[6]

This reliance on fossil generation risks undoing a decade of decarbonization gains. If 300 additional terawatt-hours of demand are met with today’s resource mix, power sector emissions could rise 125–156 million tonnes annually, about 10% of current U.S. electricity emissions.[7]


Water Stress: The Other Hidden Cost

Electricity is not the only resource under pressure. Data centers are also massive consumers of water, using on average 1.8–1.9 liters for every kilowatt-hour of electricity consumed, most of which evaporates and cannot be returned to the source.[8] In 2021, U.S. data centers collectively used about 164 billion gallons of water, equivalent to the annual consumption of a mid-sized U.S. state.[9] A single hyperscale data center can use as much water as a town of 50,000 people.

Cooling is the main driver. Most facilities rely on evaporative or evaporative-assisted cooling, which is highly efficient but water-intensive. Roughly 80% of water withdrawn for cooling is lost to evaporation, and only the remainder is discharged to wastewater systems.[10] This means water demand is permanent, not cyclical.

Emerging technologies could help. Direct-to-chip liquid cooling and full immersion cooling circulate coolant directly around processors, dramatically reducing evaporation losses. Some operators, like Amazon Web Services, have achieved water usage effectiveness (WUE) as low as 0.19 liters per kilowatt-hour by using free-air cooling and building in low-humidity regions.[11] These strategies won’t work everywhere but show how technology and siting decisions can minimize water stress.

Regional implications are significant. Northern Virginia’s data center cluster nearly doubled its water use from 2019 to 2023, reaching almost 2 billion gallons annually. In drought-prone areas like Arizona, New Mexico, and West Texas, proposed data centers face growing community opposition over water scarcity. As AI-driven electricity demand rises, utilities and operators will need to balance digital infrastructure growth with sustainable water management, including siting facilities where supplies are sufficient and investing in advanced, water-efficient cooling technologies.[12]


Can Nuclear and Renewables Close the Gap?

Big Tech and policymakers increasingly view nuclear energy as a cornerstone for decarbonizing data center demand. Small modular reactors (SMRs) are central to this strategy, offering scalable, factory-built units that can be sited closer to load centers. Amazon’s agreement with Energy Northwest aims to deploy 5 gigawatts of SMR capacity by 2039, and Microsoft’s plan to restart Three Mile Island Unit 1 represents a major step toward restoring carbon-free baseload power. Google’s partnership with Kairos Power adds another 500 megawatts of future capacity. These projects could collectively generate tens of terawatt-hours annually, but most are unlikely to deliver electricity before the mid-2030s.[13]

While nuclear energy offers reliability and low-carbon operations, it cannot close the gap alone, at least not fast enough. Renewables remain the most immediate lever for relieving pressure. PJM and MISO interconnection queues already hold more than 70 GW of wind, solar, and battery storage projects that could be online within three years if permitting and transmission upgrades were streamlined.[14] Unlocking these projects would significantly reduce the need for coal and gas peaker plants, cutting emissions and stabilizing capacity prices.[15]

Storage technologies, particularly lithium-ion and emerging long-duration storage solutions, are critical to pairing renewables with the “always-on” needs of data centers. Advances in grid-forming inverters and hybrid renewable-plus-storage projects mean solar and wind can now provide grid services, voltage support, frequency regulation, and spinning reserves, that were previously the domain of fossil generation.[16]

Policy reforms could further accelerate this transition. Federal Energy Regulatory Commission (FERC) Order 2023, aimed at streamlining interconnection, and state-level transmission planning mandates can reduce the multi-year backlog. Market reforms that reward flexibility, such as capacity payments for demand response, virtual power plants, and aggregated distributed energy resources, will also help meet peak loads without building additional fossil capacity.[17]

In combination, these solutions form a balanced approach: renewables and storage meet the bulk of incremental demand, while nuclear fills the reliability gap and keeps emissions near zero. This portfolio offers the fastest, lowest-cost pathway to align rising electricity demand with climate commitments.


Consumers Will Foot the Bill

Ultimately, higher capacity costs are passed on to consumers. Analysts project cumulative rate increases of 30 to 60% by 2030 in PJM regions. Residents in data center hubs like Northern Virginia will pay a disproportionate share, effectively subsidizing AI’s power appetite.[18]


Conclusion

The emerging power crunch is not merely an engineering or pricing challenge; it is a policy and planning crossroads. The AI revolution, data center buildout, and rapid electrification are colliding with outdated grid interconnection processes and slow infrastructure deployment. Left unaddressed, these pressures will drive higher costs for consumers, lock in fossil dependence, and risk derailing climate commitments. The solution is within reach: accelerate clean energy connections, diversify generation with proven renewables and reliable nuclear, and invest in water-efficient cooling technologies. Doing so will not only stabilize electricity markets but also enable sustainable digital growth, ensuring that innovation is powered by resilience, not scarcity.


[1] Christian Science Monitor. “Electricity prices rise as AI and data centers boost demand.” August 20, 2025.

[2] PJM Inside Lines. “PJM Auction Procures 134,311 MW of Generation Resources.” 2025.

[3] Gartner. “Gartner Says Electricity Demand for Data Centers to Grow…” 2025.

[4] Sherwood News. “Power demand from US data centers will double by 2030.” 2025.

[5] PJM Inside Lines. “PJM Auction Procures 134,311 MW of Generation Resources.” 2025.

[6] Evergreen Action. “PJM’s Latest Power Auction Should Be on Your Radar.” 2025.

[7] U.S. Energy Information Administration. “How much carbon dioxide is produced per kilowatthour of U.S. electricity generation?” 2025.

[8] Meta & Environmental and Energy Study Institute. “Data Center Water Use.” 2025.

[9] Digital Infrastructure. “Data Center Water Usage.” 2025.

[10] Meta & Environmental and Energy Study Institute. “Data Center Water Use.” 2025.

[11] Digital Infrastructure. “Data Center Water Usage.” 2025.

[12] Meta & Environmental and Energy Study Institute. “Data Center Water Use.” 2025.

[13] Reuters. “Big Tech contracts inject life into new nuclear.” February 19, 2025.

[14] Evergreen Action. “PJM’s Latest Power Auction Should Be on Your Radar.” 2025.

[15] U.S. Energy Information Administration. “How much carbon dioxide is produced per kilowatthour of U.S. electricity generation?” 2025.

[16] Grid-Forming Technology in Energy Systems Integration. Energy Systems Integration Group. 2024. — Discusses how grid-forming inverters and related technologies enable inverter-based resources (wind, solar, batteries) to provide system services like frequency and voltage regulation.

[17] Explainer on the Interconnection Final Rule. FERC. July 28, 2023. — Details Order No. 2023 and its reforms: clustering, readiness requirements, penalties, timeline for compliance. Federal Energy Regulatory Commission

[18] Christian Science Monitor. “Electricity prices rise as AI and data centers boost demand.” August 20, 2025.

Green-e® Energy Verification for 2025: How EcoEngineers Can Help You

As sustainability reporting becomes more standardized and as regulators, investors, and customers demand greater transparency, verified claims are increasingly becoming the baseline rather than the exception.

Green-e® Energy is the leading voluntary certification program for renewable energy in North America, setting standards to ensure claims are accurate, transparent, and supported by properly tracked and retired renewable energy certificates (RECs).

If you plan to make Green-e Energy claims for Reporting Year (RY) 2025, it’s crucial to start planning early to ensure data accuracy and availability, internal review cycles, and verifier capacity. Verification reports are due June 1, 2026, so it’s time to select your verification body and prepare for reporting to avoid delays.

How EcoEngineers Can Help

EcoEngineers, an LRQA company, serves as a Green-e Energy verification body, assisting organizations in assessing their readiness, organizing documentation, identifying potential issues early, and streamlining the verification process, especially as teams prepare for 2025 reporting.

EcoEngineers is accredited by the American National Standards Institute (ANSI) National Accreditation Board (ANAB) as a greenhouse gas (GHG) verification body. Our team of experts includes auditors and Certified Public Accountants (CPAs) in renewable energy compliance who provide clear, accurate, and reliable verification. We support organizations across renewable energy and environmental markets with verification, certification, and compliance services. This includes:

  • Reviewing REC procurement and retirement records
  • Confirming eligibility of generation sources
  • Aligning internal data owners and timelines
  • Checking marketing and disclosure language against Green-e requirements
  • Identifying gaps early enough to resolve them before reporting deadlines


For more information about EcoEngineers’ Green-e services and capabilities, please contact:

Dan Ciarcia, Senior Carbon Consultant (EV, Hydrogen & RNG), dciarcia@ecoengineers.us
Randy Prati, Vice President, Strategic Initiatives, 
rprati@ecoengineers.us